If I Had a Dollar for Every time…

Someone told me the dollar was going to crash … I’d have a dollar worth as much as usual.

Lots of talk about how the dollar is going to crash, not be the “reserve currency” (news flash it hasn’t been a reserve currency since Woodstock), etc.

Here’s a chart of the dollar index over the last 50 years.
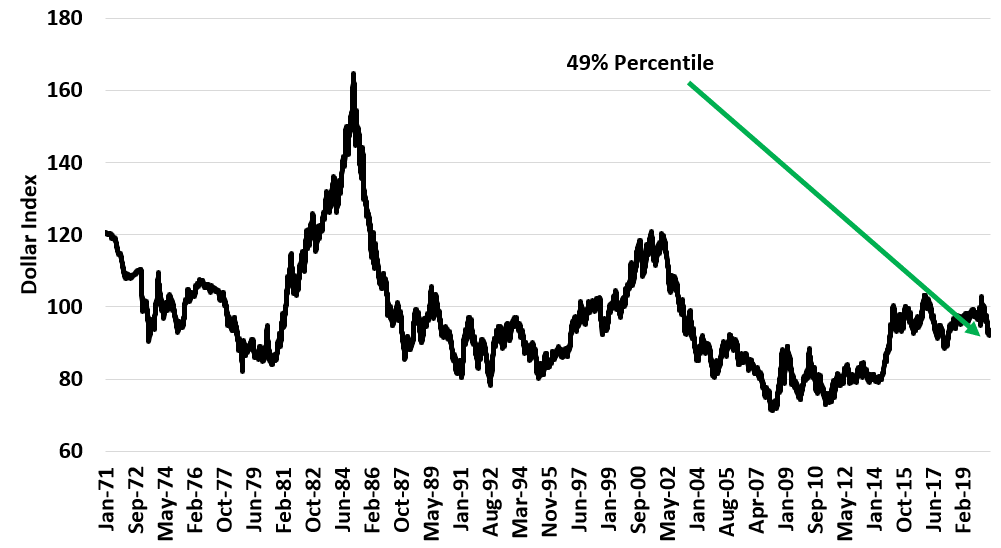
The dollar is literally at the midpoint of the range. There is nothing to see here.

In fact, this line of argument about reserve currency is even dumber than always. I’ll explain why in my next post.
This is Not the Inflation You are Talking About

The Fed came out today and say they are going to look at average inflation over time. So if inflation is below 2% this year it can be a bit above 2% next year. People are taking this to mean the Fed almost will never raise rates.

Well, that is kind of true. But it’s not because we don’t measure inflation above 2%. it’s because of the inflation measure the Fed prefers.

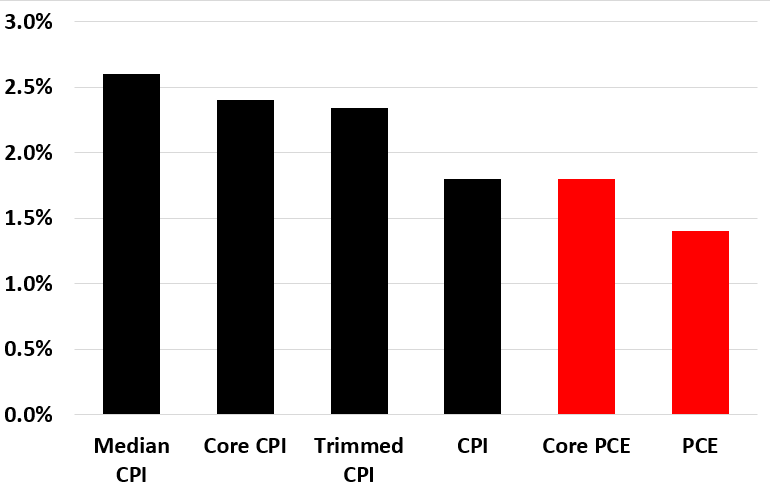
This is a graph looking at the average rate of inflation in the U.S. over the last three decades.

Median CPI, Core CPI, and Trimmed CPI are all different ways to try to remove volatile outliers from the data. In all 3 cases, the average inflation rate is more than 2%.

CPI includes everything – food and energy unlike core CPI . It’s less than 2%.

PCE is another way to measure inflation. The Core value over the last 3 decades is 1.8%. For the other core inflation measures, it’s 2.3% – 2.6%. Thus, PCE runs about 0.5% to 0.6% lower than other inflation measures.

Guess which one the Fed likes?