Party Like It’s 1999

Another week has gone by. The market is up, earnings estimates are down. Here’s an updated graph for Forward Price-to-earnings ratio, where you can see we are partying like it’s 1999.
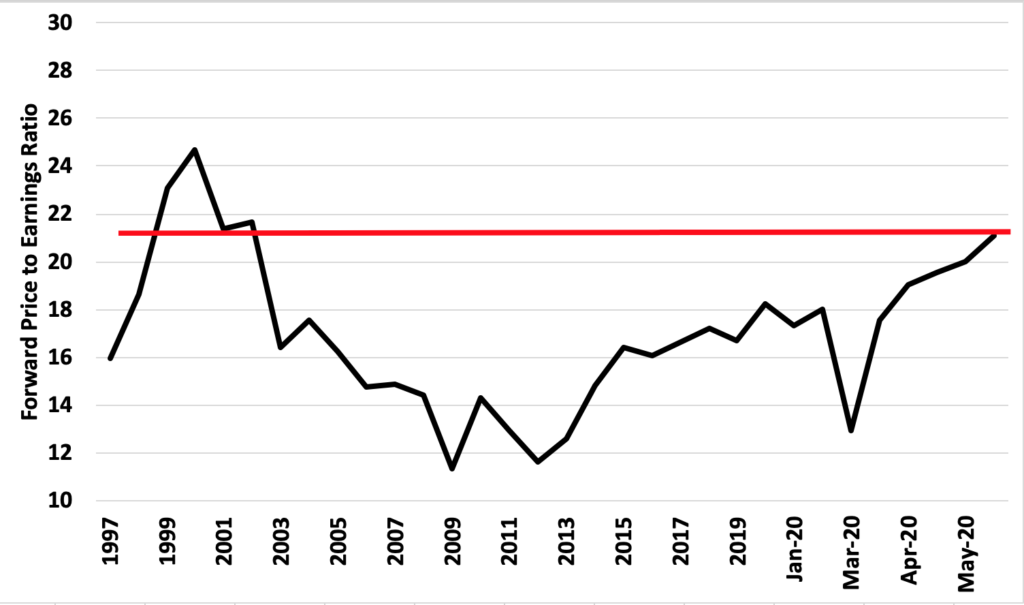
Forward P/E ratio

You can forward P/Es continue to increase. This is because the market is increasing, all be it not that much. The real issue is that earnings estimates for the year continue to decline. Expectations are earnings for the year will now decline 20%.
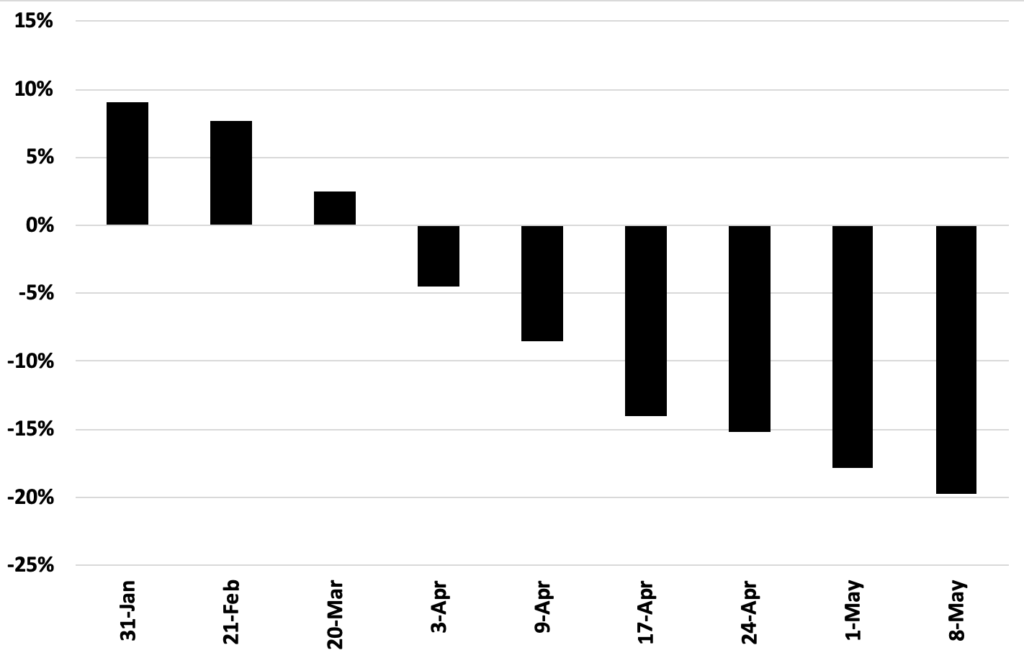
The bottom line is this market is not cheap on a P/E basis.
Unemployment Rate: 18.9%

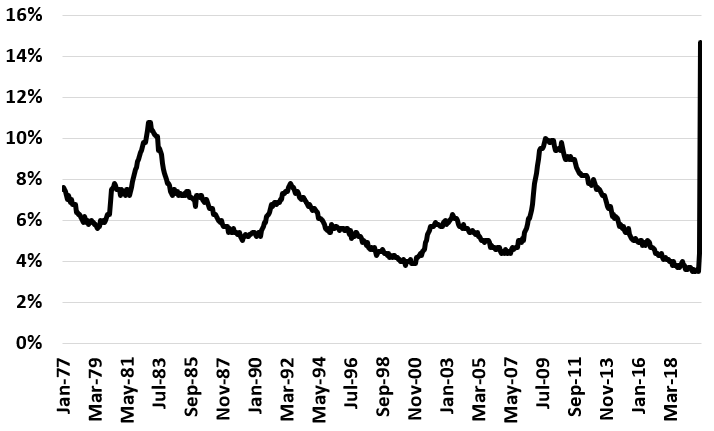
The April jobs report say the unemployment rate is 14.7%. It’s the highest since the great depression. The Actual unemployment rate is 18.9%. (It’s actually way higher now.)

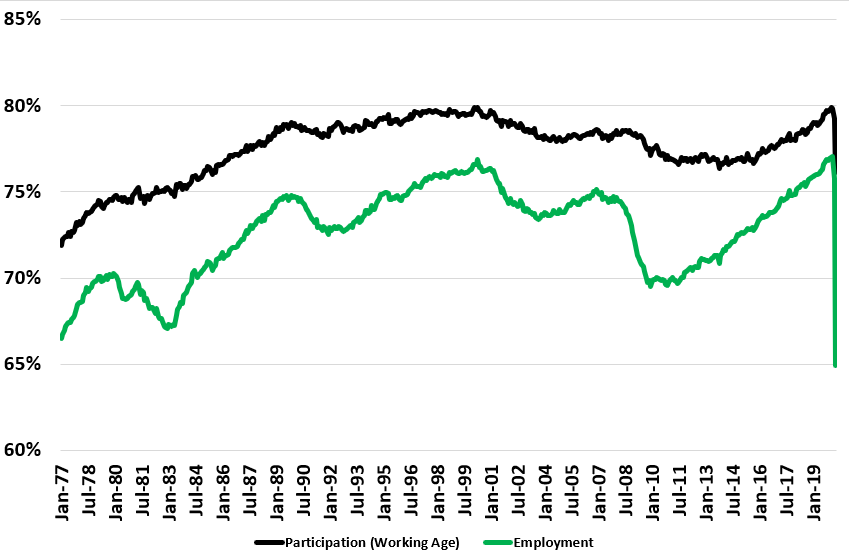
Why the difference? This graph explains the story.

Participation and Employment Levels of the Working Age (16-65) Population

We actually lost 25 million jobs last month. The reason the unemployment rate isn’t higher is because 8 million people dropped out of the labor force.

If we kept those people in the labor force, the unemployment rate would be 18.9%. Even with the 14.7% number, that’s the highest unemployment since the Great Depression.

Reported Unemployment Rate

Note that the jobs report is based on data halfway through the month. Since this report, we’ve lose another 12 million jobs, so the actual unemployment rate is closing in on 25% now.