Well, That Escalated Quickly

While we have been focused on things like oil, used car prices, etc. perhaps the biggest price increase over the last 12 months has been in housing. While home prices are up 20%, that truly understates the price increase to buyers.

In this graph, I show the year-over-year change in the payment for the average priced home. There are two pieces that drive the change: 1) home prices themselves and 2) mortgage rates.
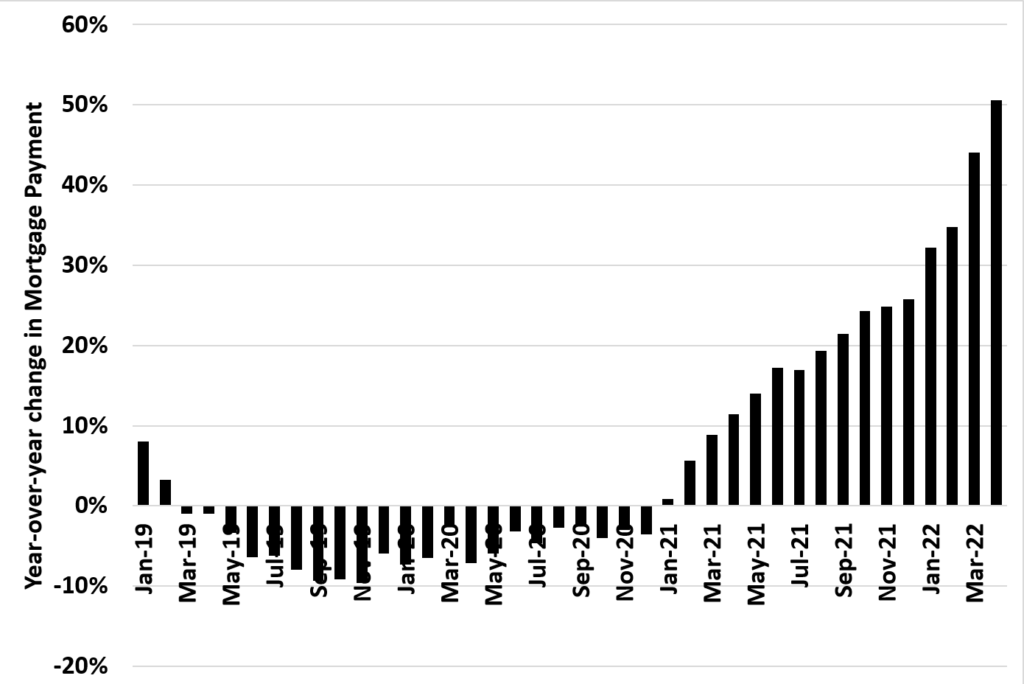
When the pandemic started, housing prices increased but the decreased mortgage rates made housing actually cheaper on a monthly payment basis compared to pre-COVID.

However, now payments are up over 50% year-over-year as mortgage rates touch 5% and home prices are up 20% year over-year.

This large increase will certainly have an impact on demand, especially institutional demand which has been almost 1/2 of purchases in a lot of markets.
Recession Watch 2023

If you have heard me give an econ forecast this year, I’ve spoken a lot about how the Fed’s forecast was too high. I’ve also mentioned a coming glut in 2023. Well, the financial markets are finally catching up.

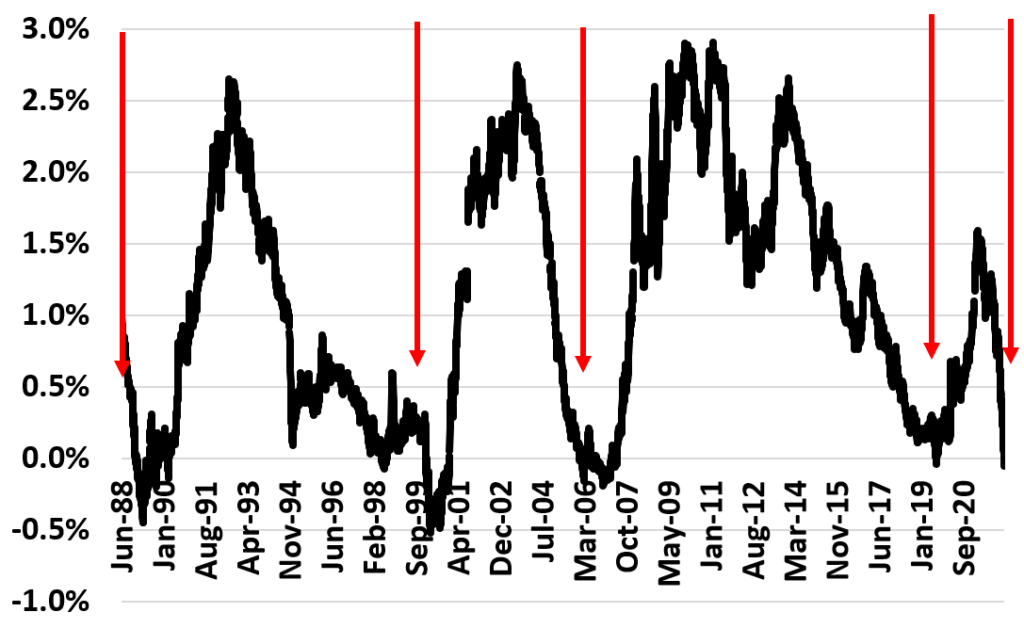
This graph is what we call the yield curve. It is the difference between the 10 year US Treasury interest rate and the 2year interest rate.

As you can see, the difference is usually positive. This indicates an expectation of a growing economy.

However, a few times over the last 30 years it has gone negative. and EVERYTIME (cue Britney Spears song) we’ve then had a recession.

Whelp, it just went negative again. And there are lots of reasons to think that things will slow down a lot next year:

  • No more fiscal stimulus
  • People having to go back to work so less time to spend money
  • Gas price shock
  • We’re out of people
  • and MOST IMPORTANTLY: The Fed is going to raise rates. A lot.

The bottom line is we are in line for some very slow growth next year – or maybe even negative.