OC Covid Data: Still Climbing

Here’s the most updated data on OC testing. Note the data for number of tests was updated for the prior week (surprised the update on testing was so large).
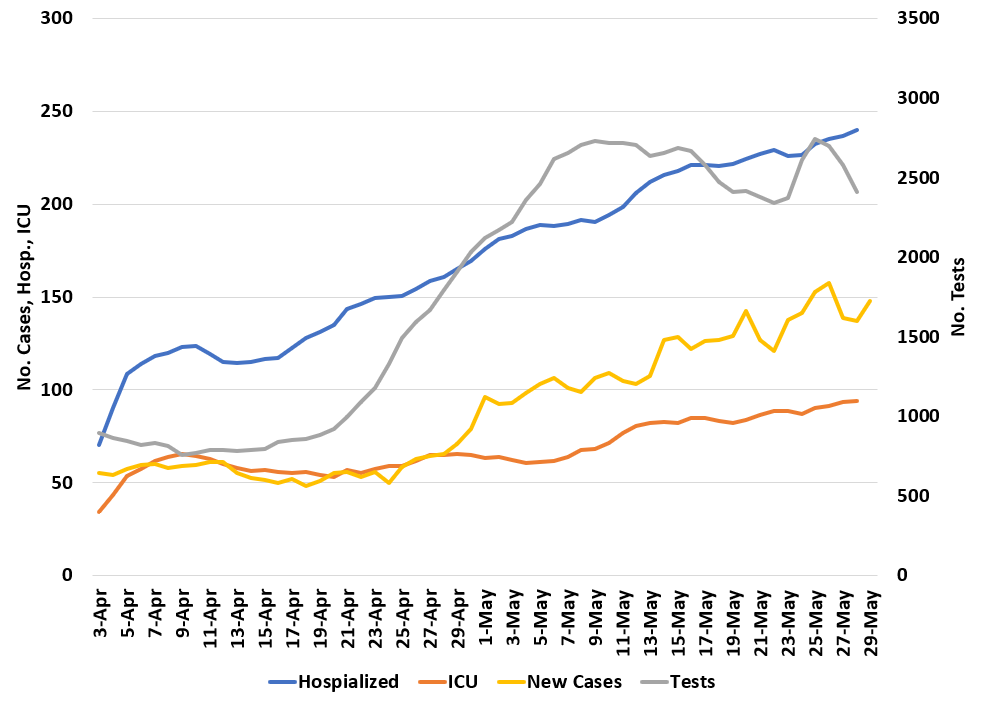
Left Axis: 7-day moving average of new daily cases, Hospitalizations, and ICU patients. Right Axis: Number of tests

As you can see, the number of pretty much everything is at all time highs. Cases came down a little this week.

The next question is: Will Memorial Day festivities bring a surge of cases next week?

Policy is Changing

It’s clear policy rules are changing: OC has record high 7 day average hospitalizations, deaths, and new cases… and yet continues to reopen. See the data here:

Number of New Cases per Day, Hospitalizations, and patients in ICU (left axis) and Number of Test (right axis)

Note the number of tests has been declining so this isn’t a testing increasing issue. Plus deaths and hospitalizations doesn’t depending on testing asymptomatic people.

The question is what this means for our recovery and economy. We will see soon what percentage of the decline in demand is due to mandatory stay-at-home and what percentage is due to people voluntarily staying away due to fear.