As we wrap up August, you will inevitably see articles how we are entering a terrible period for the market – Sep and Oct. However, it’s not true. In fact, what if I told you the best month ever was in October?
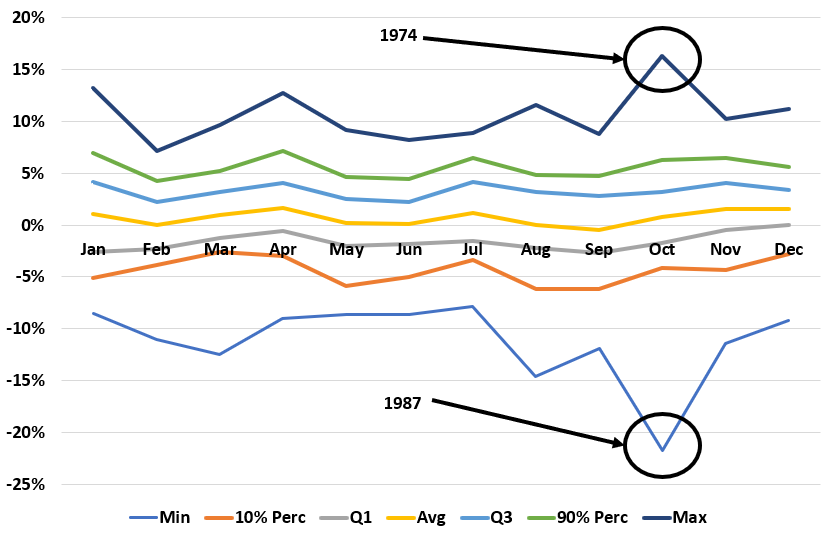
Here is the Minimum, lowest 10%, Q1 (lowest 25%), average, Q3 (75% highest), 90% highest, and maximum return for the stock market since 1950.

You can see October has 2 outlier returns. 1987 – which by the way the market was back in just a few months and 1974.
If you remove those two outliers, you can see there is no difference between Sep and Oct and other months.
This doesn’t change the fact the market is way expensive or that we have COVID or an election etc. But there is no reason to expect the market to decline just because it’s Sept or Oct.
