Thank Goodness for No Commissions

Yesterday I documented that the number of Robinhood accounts has soared. Here is the annualized position turnover of Robinhood users.
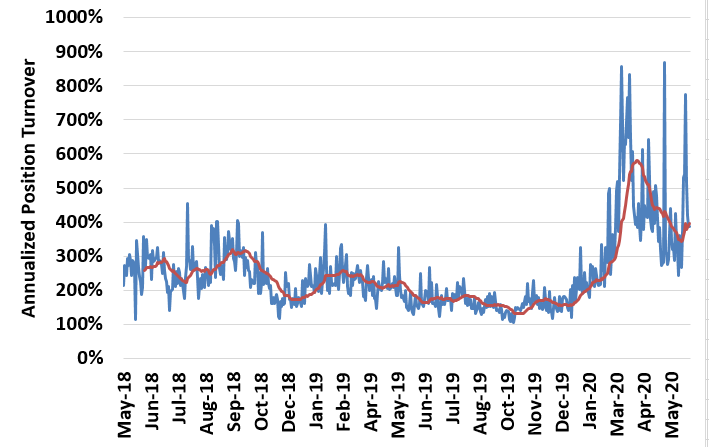
Annualized Robinhood Position Turnover, red line 30 day average

Before this year, position turnover was somewhere around 100-200%, which is not that much different than most actively managed mutual funds.

However, since March, turnover has soared – hitting close to 1000% annualized. Today the 30 day average is close to 400%.

Again, this is not investing. This is trading. We’ll see later whether the RH users or the house is winning.
A Five Headed Market

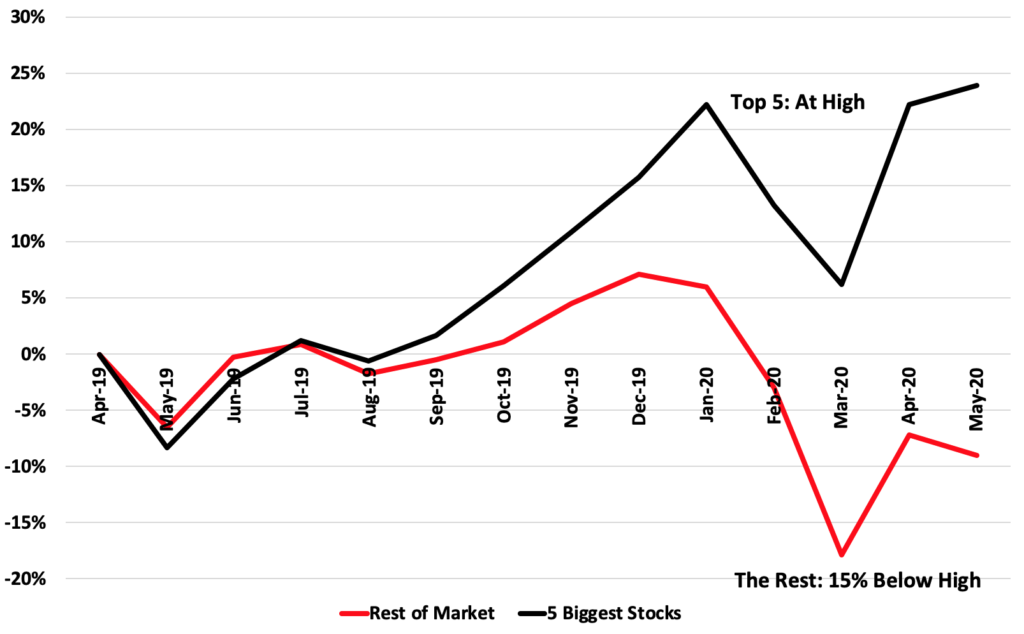
Many stock indices have recovered substantially from the lows in March. However, a lot of that is simply due to the largest 5 stocks in the market. (Apple, Microsoft, Amazon, Berkshire Hathaway, and Google)

Here is the average return of the top 5 stocks vs. the Wilshire 5000 return minus those 5 stocks (value-weighted).

Average return of the 5 largest stocks and the rest of the market (value-weighted)

While you have seen your returns go up outside those 5 stocks, you can see you are well below your all time high.

The question is how is this gap made up? Do the top 5 stocks fall? Do the bottom thousands of stocks rally? We’ll see what happens.