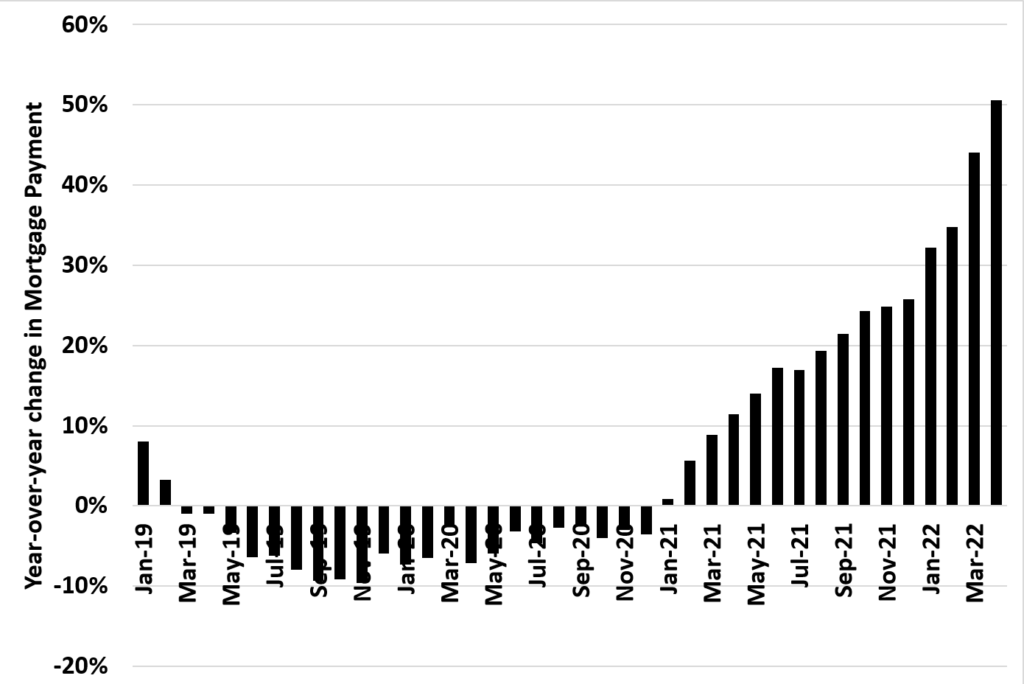
One of the most interesting things in finance right now is the Real Estate market. Home prices may have bottomed, but no one is selling. It’s really not a market. Why? Affordability is awful. Worse than the housing bubble.
In this graph, I take home prices since 1988. Each year I change the average price of a home by Case-Schiller national index. I use average wages each year to calculate the real income you need to afford the average home. This way you can compare income across time. Here’s what you get.
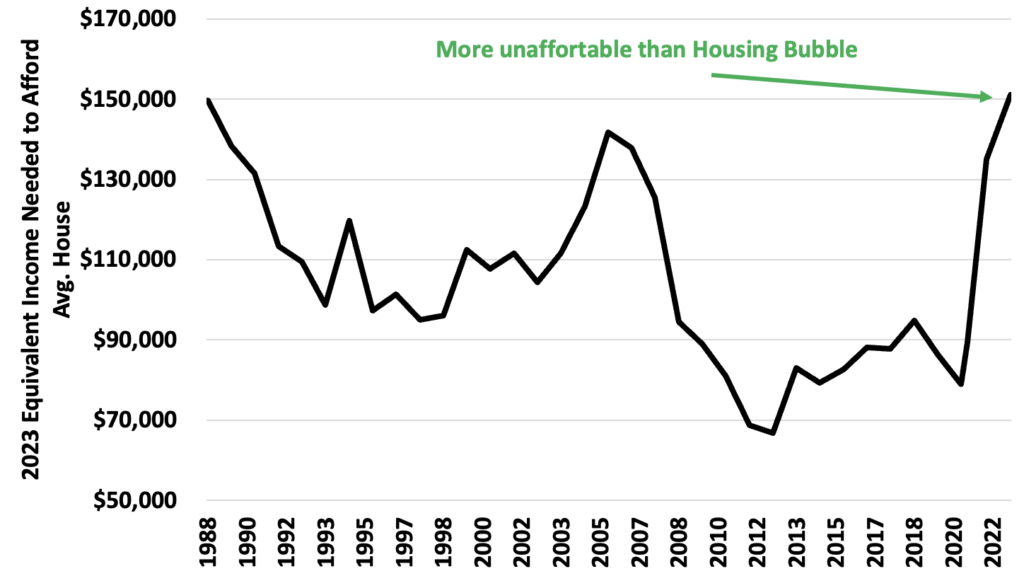
That is not a typo. Housing right now is even more unaffordable than during the housing bubble. In fact, over the last 35 years, housing has never been LESS affordable.
The question is where do we go from here. It’s hard to say. Rates are high so people are locked in. Hybrid work makes it less likely you need to move for a new job. My guess is nominal prices changes will be less than inflation for the next few years to get affordability up, but until we get more volume it’s hard to say how things get back to normal.
Or we could be going to the Europe model where homeownership is a luxury, not a dream.