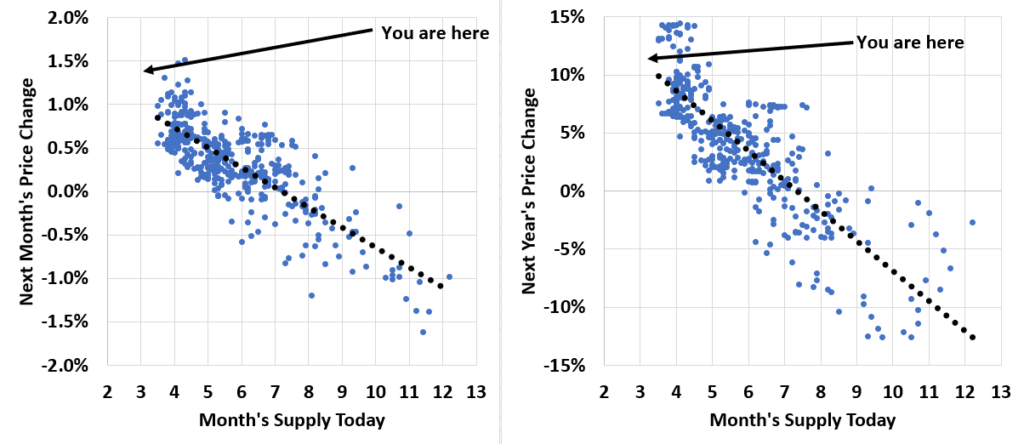
I continue to believe the housing market will do well. Why? These two graphs sum it up.
The x-axis is the number of months of supply of houses today. The y-axis on the left is next month’s house price change and on the right is the next 12 months house price change.

As you can see there is a incredibly strong negative correlation between inventory and price changes. The lower the inventory, the bigger the positive price change.
As you can see, we are near the lowest inventory on record. This suggests very high price appreciation over the next 12 months.