… and that ain’t bad.
Good payroll number – up 1.76 million jobs. (Of course we are still down 13 million jobs). The real question is: Did that many jobs come back? I’m not sure due to seasonal adjustments.
Really quick review: Many, many economic data has a season pattern. Think about gas prices. They are higher in the summer than the winter on average. Thus, inflation has a seasonal adjustment to show rising prices of gas in May is not truly inflation.
Payrolls have the same pattern. For example, many seasonal works get hired in October and November. They start getting laid off in December for the holidays and then are laid off in January. Thus, November and October you have to adjust payrolls down to get the real number and December and January you have to adjust up.
The same issue happens in the July. In July many many state works are laid off- like teachers – who are then hired back in August and September. So we have to make a big adjustment up to control for that
The amount of seasonal adjustment is estimated by looking at past data. The problem is what happens when the seasonal pattern is thrown off by something like, you know, a pandemic.
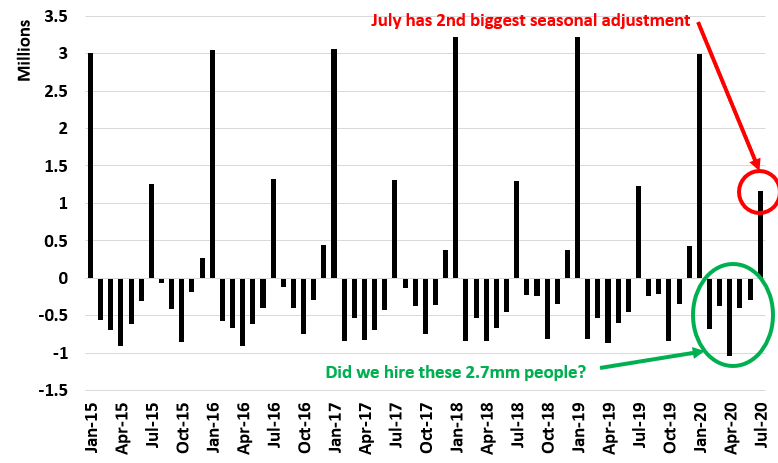
Here’s the difference between the seasonal adjusted number and the actual number for payrolls

You can see the pattern I described in Dec and Jan as well as July. This year the seasonal adjustment factor added 1.12 million jobs.
Is that number correct? I highly doubt it. Because I’m also sure we didn’t add 2.7mm extra temporary workers from Feb to June.
Thus I would guess the true payroll number is much, much closer to zero.