OpenTable Data and Employment

Restaurant traffic has been falling as the number of new cases and hospitalizations for COVID-19 has been rising. Why is this important? Because it will impact employment.

This graph overlays employment numbers from the Census Bureau’s Pulse Survey (black line) against the year-over-year change in OpenTable restaurant traffic data.

You can see they correlate pretty well.

According to the Census data, we’ve lost about 1.5mm jobs since the last employment report. Opentable data is updated more frequently. It continues to fall, suggesting that the number of jobs lost since the last employment report is closer to 2 million jobs now.
Job Recovery Good… and Bad

Most people today are focused on the 4 million job number. I’ll note that the 11.1% unemployment rate is still worse than any point during the great recession.

The more concerning part is a. the continued growth in permanent job losses and consistent initial claims and now continuing claims.

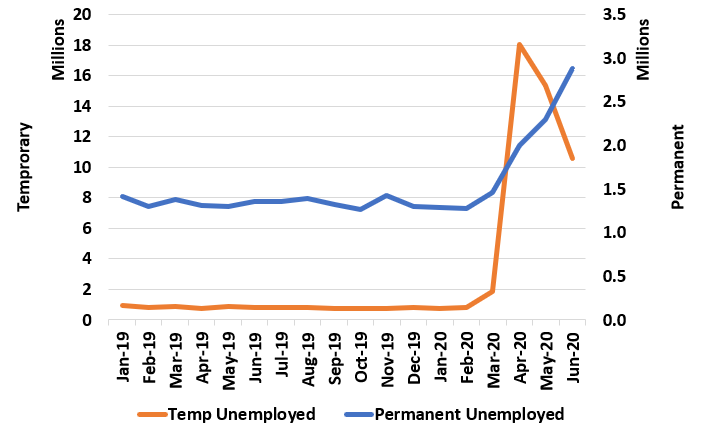
Here’s a graph comparing the number of unemployed persons on a temporary and permanent basis.

While temporary layoffs have been reduced, some of that is because they have become permanent layoffs. These will be much more difficult to recover going forward.

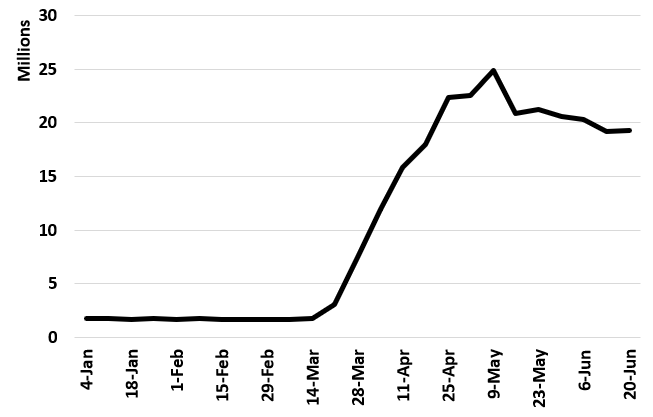
Not only that but continuing claims, which has fallen almost 5 million from the peak has stopped declining.

Continuing Claims

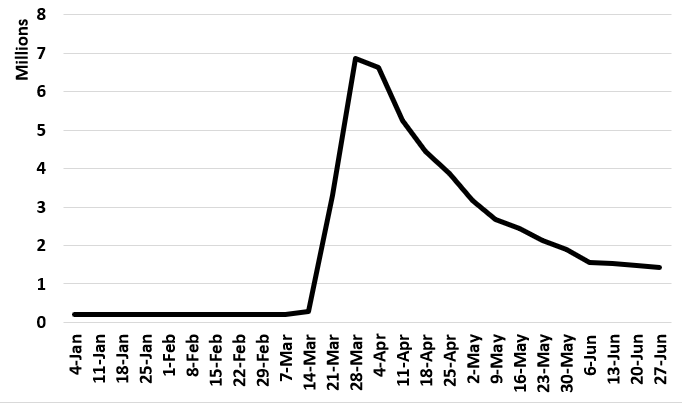
And new claims is stuck at 1.5 million a week. Which sounds better than 7 million a week, but is still 2.5 times higher than ANY point before COVID-19.

Initial Claims

The bottom line is this is a good report. Future reports may not be as rosy.