OpenTable Data and Employment

Restaurant traffic has been falling as the number of new cases and hospitalizations for COVID-19 has been rising. Why is this important? Because it will impact employment.

This graph overlays employment numbers from the Census Bureau’s Pulse Survey (black line) against the year-over-year change in OpenTable restaurant traffic data.

You can see they correlate pretty well.

According to the Census data, we’ve lost about 1.5mm jobs since the last employment report. Opentable data is updated more frequently. It continues to fall, suggesting that the number of jobs lost since the last employment report is closer to 2 million jobs now.
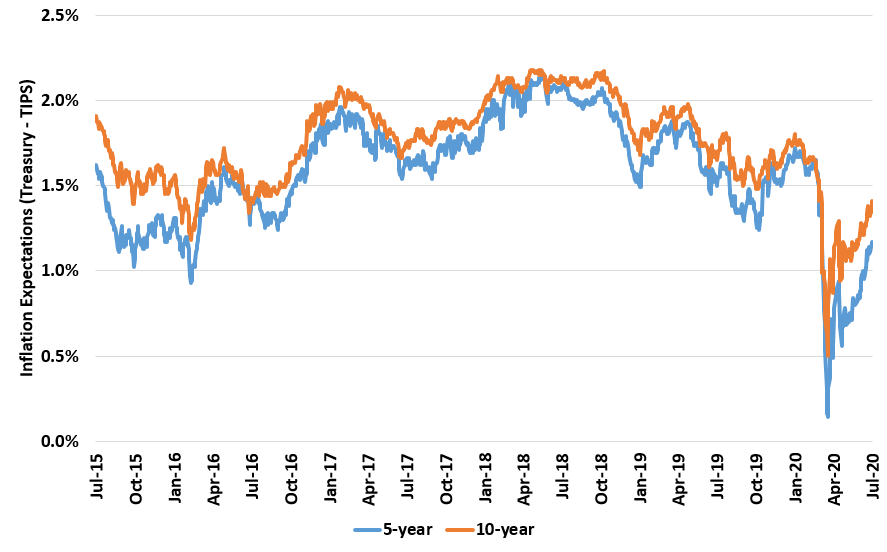
Inflation Expectations are… well, Inflating

One of my concerns is that the reduction in supply for products due to closed businesses and supply chain issues coupled with stimulus money will lead to inflation. The market is starting to expect more inflation as well.

This chart is the Treasury Yield (Nominal) minus the TIPS yield (real), which gives you inflation expectations.

When the crisis first hit, inflation expectations for the next 5 to 10 years crashed and were at less than 0.5% per year.

Now inflation expectations are 1.2% per year for the next 5-years and 1.4% for the next 10-years, up quite a bit from the bottom.

I expect inflation expectations will continue to increase from here, giving a boost to Gold, TIPS, and firms with good dividends and pricing power.