A very surprising jobs report this morning. The economy added 2.5mm jobs last month!
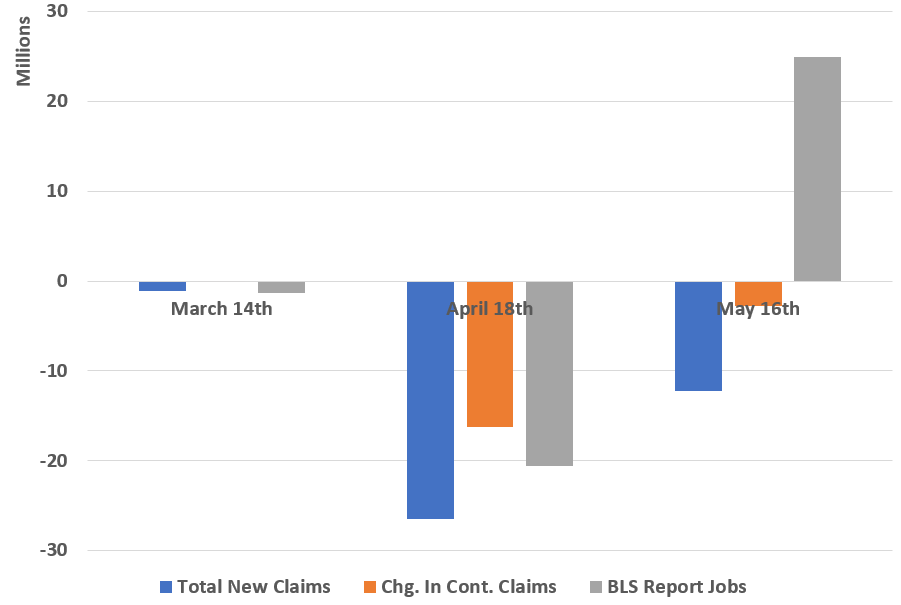
Why is this so surprising? All the other data says the economy lost jobs last month. This graph shows the number of new jobless claims, the change in continuing claims, and then the change in jobs reported by the employment report.

The May Job’s number looks very odd compared to the rest of the data. It could just be some “rounding error” from the huge numbers last month.
Please note this survey was completed the week of May 12th. That means this was finish BEFORE ANY REOPENING. This is not about a recovery. This is about something else. I have a theory which I’ll discuss on Monday.
