Gravity Applies to Finance Too

The last 24 hours has seen many of the, what I will charitably call, speculative stocks (and other assets) have large corrections. With I’m not sure the party is over, this is likely a trend to continue.

This is a graph of the ratio of the NASDAQ Composite to the Dow Jones.
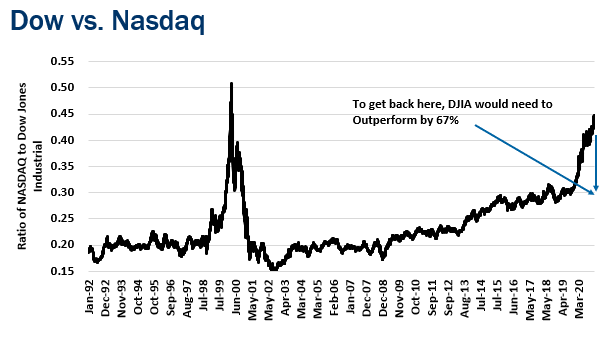
Even after yesterday, the DJIA would need to outperform the NASDAQ by 67% (!!!) to get back a more normal ratio.

Could it be different this time? Maybe….. but I’d take the DJIA over the NASDAQ the next few years.

NASDAQ to NYSE Ratio

One of the amazing things the last couple of years as been the run in large tech names. The question is: will that run stick? As I mentioned on a previous post they can’t outperform forever.

Another way to look at the current environment is the ratio of the NASDAQ index to NYSE. Here is the ratio over time:

I’m not sure I need to add a lot of commentary to this graph, but this is the largest this ratio has ever been. I think some of this is permanent, but some of it is probably … temporary.