Last week, the Fed met. They said interest rates would remain at zero. They would continue asset purchases. They still view inflation as transitory. But there were *HUGE* shifts in the market. Why? Due to the “dot plot.” Let’s review.
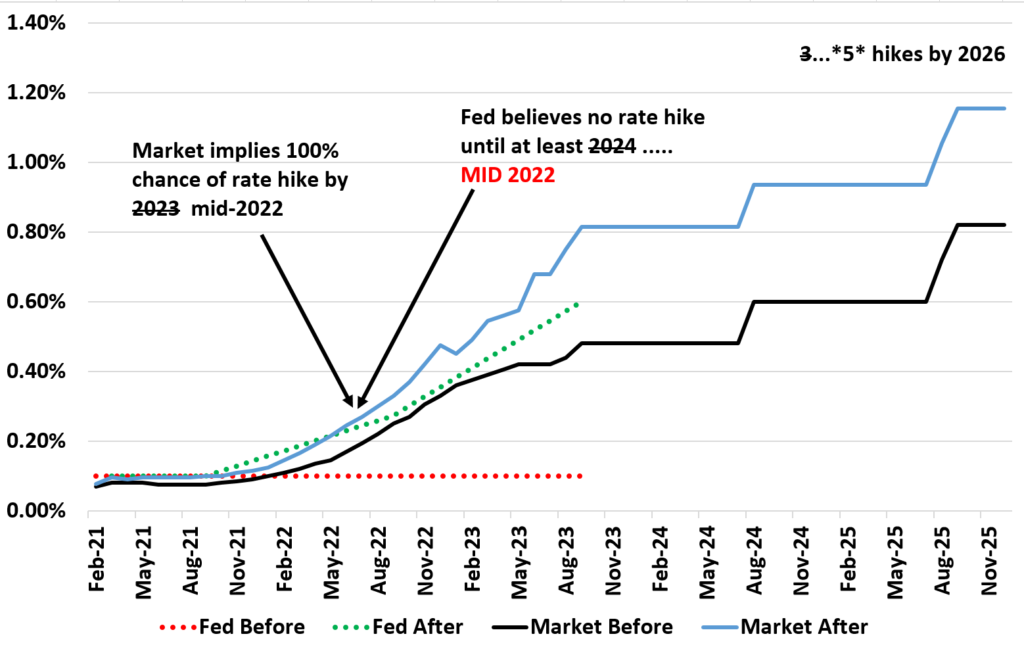
In the graph below, I have four lines: The Fed’s expectations for interest rates prior to the meeting and their new expectations now. These are the averages from the “dot plots” release by the Fed. I also include the market expectations before and after the meeting.

Prior to the meeting, the Fed didn’t even have a date when they would likely raise rates. After? The date changed to Mid-2022, which is “only” a year away. This is a HUGE change in expectations.
In fact, the Fed now agrees with the market. Except the market now beleves we’ll have 2 rate hikes in 2022, another 2 in 2023, one in 2024, and one in 2025. In short, short-terms rates will be rising MUCH quicker than previously anticipated.
This is a really big change in expectations give the Fed statement read like it was the same ol’ same ol’.
The impact on the markets is easy to see:
- 10-year yield down 0.10%
- 5-year inflation expectations down 0.20% per year
- 10-year inflation expectations down 0.20% per year
- 10-year minus 2-year is down 0.2%
What does all of this mean? The market is expecting the Fed to raise rates sooner, which means less inflation AND less growth.
We’ll see soon whether or not the Fed is trying to “talk” the market down or if they will start to act. The Fed will need to taper bond purchases before they can even think about raising rates.
(Movie quote from “Get Him to the Greek.” The meaning is you are saying one thing and thinking another. Here the Fed is saying nothing changes, but the box plot has a huge shift.)
