One of the first things to understand when looking at an asset is what drives long-term returns. While people say for RE it’s location, location, location, at a macro level it’s location, inflation, and mortgage rates.
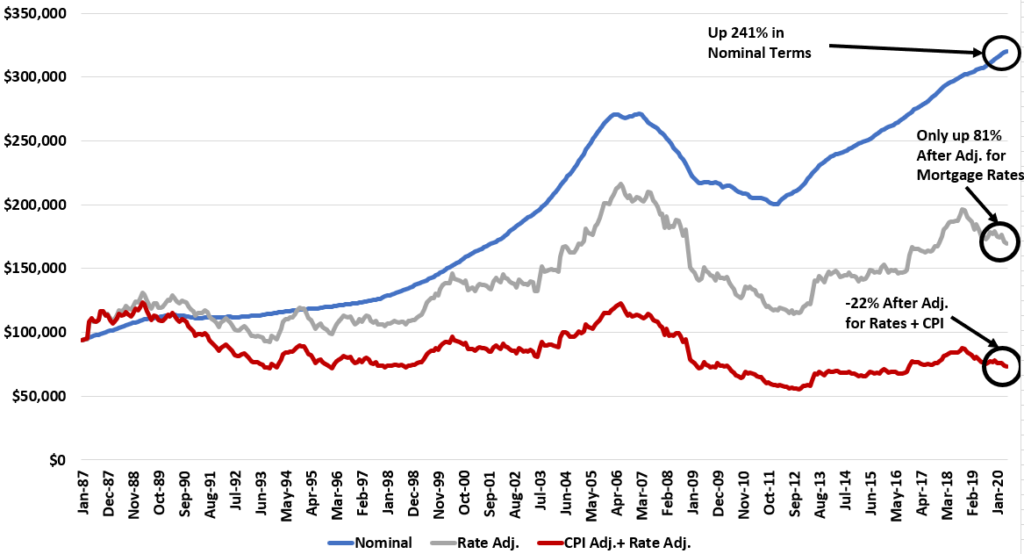
This graph shows you the famous Case-Shiller index (blue line). It’s an index of nominal prices for housing. It’s up 241% over the last 3 decades.
I then make two adjustments. The first is I adjust for the fact that mortgage rates have gone from 10% to 3% over this period. I calculate how much house prices would be rates stayed the same.That is the grey line. You can see after that adjustment, house prices are only up 81%.
I then adjust for inflation by using the CPI index as well as rates (red line).

As you can see, the entire increase in house prices the last 30+ years can be explained by inflation and mortgage rates. About 2/3 of the price change is due to mortgage rates going down and 1/3 inflation.
Thus, future prices will depend on those two things as well. I’m not sure rates can go much lower, which will be a drag on price increases in the future.
