Stock Market: The Ultimate TVM Example

As COVID cases have picked up here in the U.S., restrictions have increased. But you don’t need restrictions as people will voluntarily avoid restaurants and travel. You can see this in the graph below as restaurant traffic is down and TSA data has been flat.
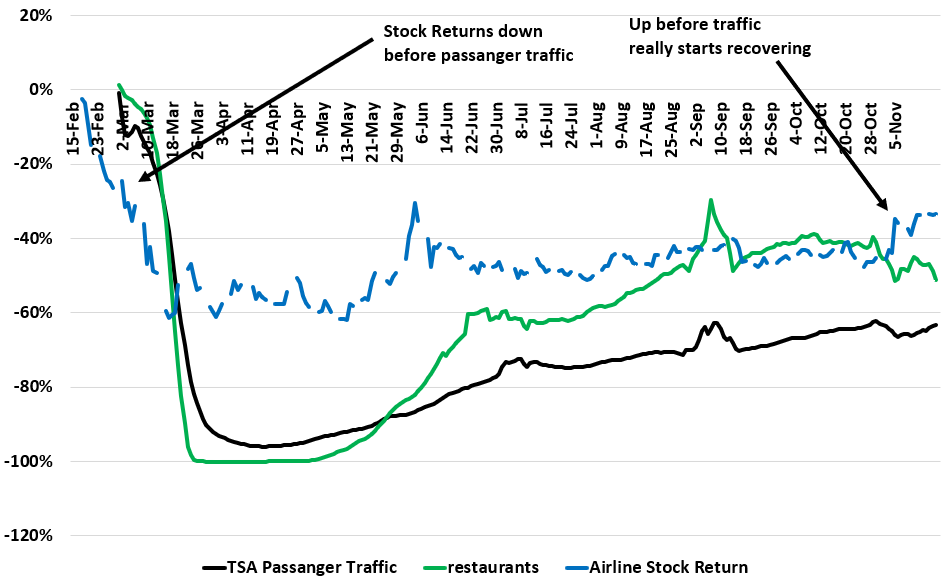
The really interesting thing is how much the stock market has a forward discounting mechanism. I have plotted Airline stock returns starting on February 14th.

Airline stocks were down almost *30%* before the passenger traffic started declining here in the U.S. Now, these stocks are the same price as they were before traffic started to decline, even though passenger traffic is down 65% still.

This is what the market does and why sometimes the stock market seems crazy. It’s being crazy like a fox by figuring out where things will be in a few months, not where they are today.
‘Tis the Season to be Overweight (Equities)

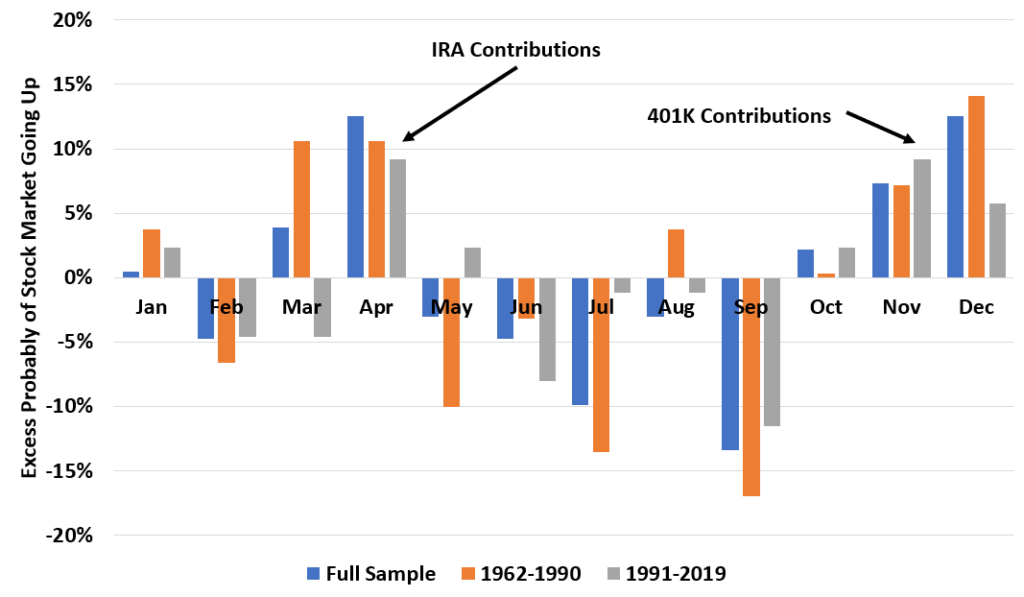
While the average and median returns of the stock market are fairly equal across the months of the year, your chances of winning are not.

Here is a figure that calculates the probability the stock market goes up in each month. This is from 1962 to 2019. I did two equal subperiods as well to show this is not a random data error. Note because the stock market has been more bullish recently this is the EXCESSS probability of going up.

You can clearly see the pattern: Stocks are most likely to increase in April and Nov/Dec.

Why? In April everyone is making IRA contributions before the Tax deadline. In Nov and Dec, everyone is trying to make 401k contributions (and related retirement investments) before the December 31st deadline.

Thus, if you like to play the horses so to speak, this is a good time to get overweight the market.