One topic that has come up recently is the concentration of the stock market. Right now, Apple, Google, Berkshire Hathaway, Amazon, and Microsoft make up a huge part of the market.
Here’s a graph that shows the amount of the stock market the Top 5 stocks represent in terms of total market cap.
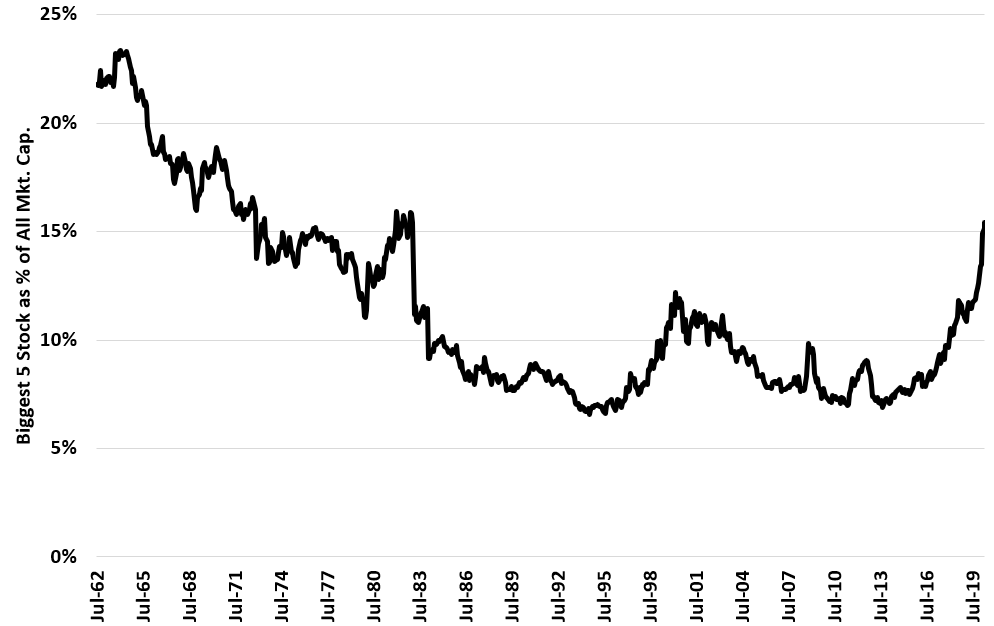
As you can see we are at the highest levels since the 1980s. While the number of stocks has declined, it wouldn’t cause this big a jump.
The $64,000 question is… does it matter? Let’s look at the average monthly stock return over the next 12 months against stock market concentration.
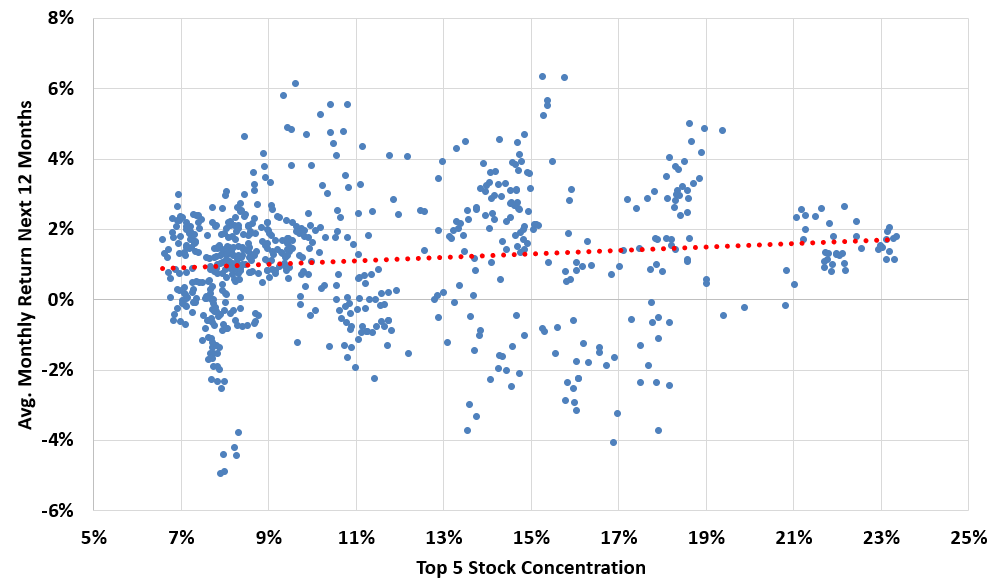
As you can see, there is virtually no trend. The difference from top to bottom is actually a positive 0.8% per month.
What does this mean for the Top 5 stocks going forward? Let’s see those returns.
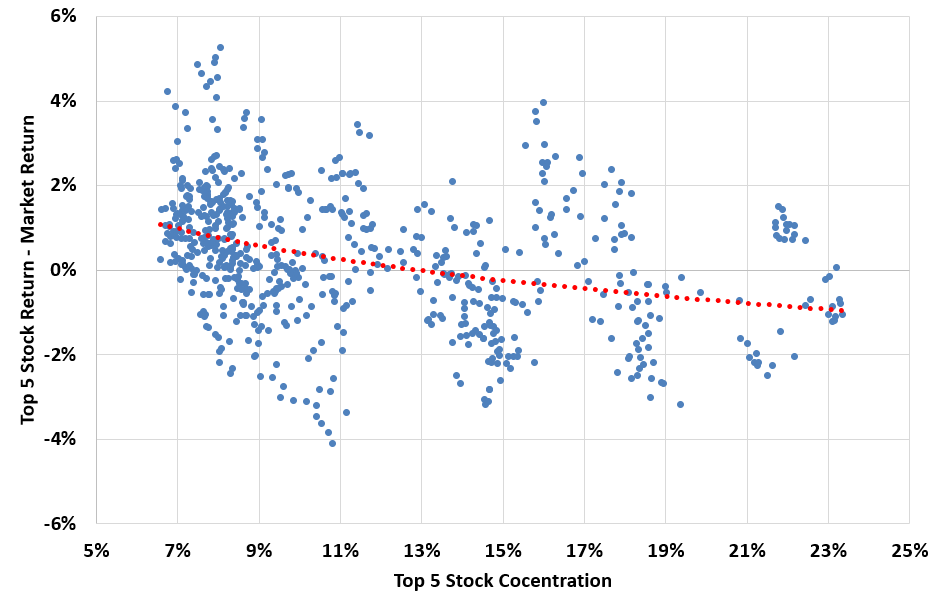
This relationship is negative. It makes sense. The top 5 stocks will not become the entire stock market. Thus, the more the represent, the less room they have to grow in the future. The difference is almost -2% per month from the top to the bottom.
Conclusion: Stock market is getting more concentrated. Nothing to worry about by itself, but the top 5 stocks may start to underperform at some point.
