One of the most recommended portfolio allocations is 60% equities/40% bonds. That’s why this article entitled “The 60/40 portfolio allocation keeps burning investors, so why do they still use it?” caught my attention.
It starts off with the usual ‘end of the world’ comments about how these portfolios “… failed previous generations of U.S. savers, and badly, during at least two extended periods during the past century alone…” and that of course “…those occasions had more than a passing resemblance to the situation today.”
So let’s look at the evidence. Quoting the article:
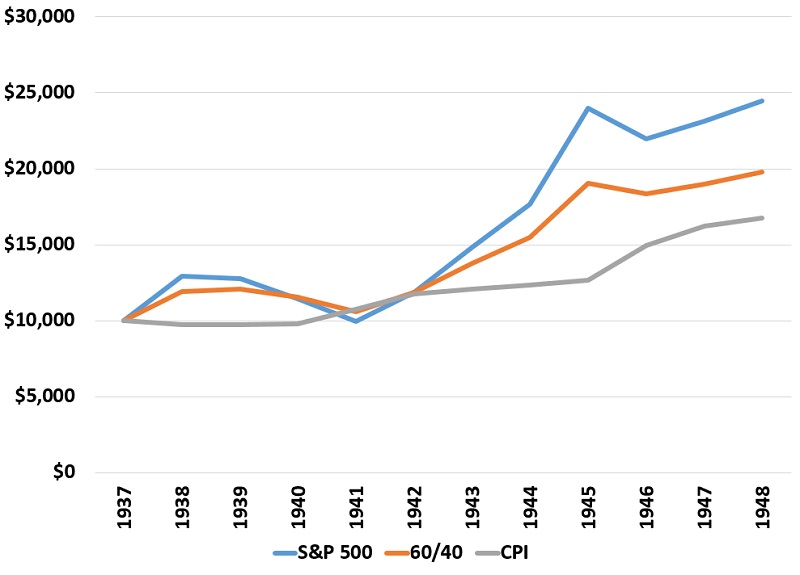
“Here are the numbers. For an entire decade, from 1938 to 1948, a portfolio of 60% U.S. stocks and 40% U.S. Treasury bonds actually went backwards in relation to inflation. That’s based on data compiled by New York University’s Stern School of Business, as well as inflation data tracked by the U.S. Department of Labor.
Over that period, not only did savers not get rewarded for investing, they got penalized. Their portfolios lost purchasing power. Furthermore, that’s before taxes. If inflation is 5% and your portfolio rises 5%, you earned a zero “real” return but you are getting taxed as if you earned 5%.”
I am going to ignore the fact it is difficult to imagine how this has a resemblance to today. During this period, we had World War II, almost all young men out of the country, and price controls.
Regardless, Let’s look at the data. NYU has data on returns here. The Bureau of Labor Statistics (Part of the Department of Labor) does not publish CPI before 1947 so I’m not sure where the author got that data. Robert Shiller include it in his data, however.
Here are the returns of stocks, a 60/40 portfolio, and CPI from 1938 – 1948. (I assume the investment includes 1938 returns.)

In the 1938-1948 period, Only one year – 1941 – is cumulative CPI higher than the 60/40 portfolio. Maybe I’m missing something. Let’s see what the next period is:
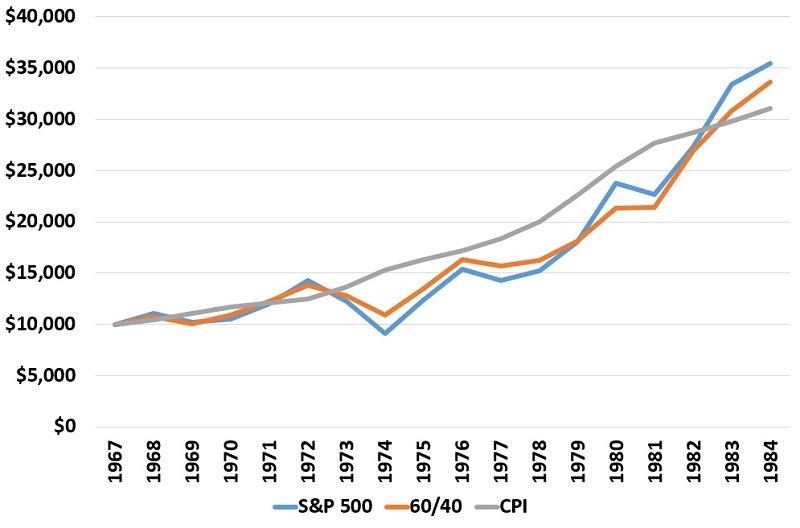
“The story was even worse 30 years later. Someone who bought a 60/40 portfolio in 1968 saw it lose nearly a third of its value over the next six years in real terms. They were still underwater 15 years later — an aeon when it comes to financial planning for college funds or retirement. Not until 1984 did they even get back to where they had been during the summer of love.”
So once again we have Vietnam and coming off the gold standard so not sure it’s apples to apples but let’s look at the data.

This looks more accurate. I guess the author means buying at the END of 1968 since in 1974 the portfolio is down about 30% in real terms. However, the article is a little misleading. The 60/40 portfolio outperforms stocks over that 6 year period and isn’t that far off over the 17 years.
So in summary, in one of the periods, the author is wrong. In the second, the author is right, but really cherry picked the dates. If you invested in 1974 instead of 1968, you would have real returns going forward. This is why you never switch your portfolio at once.
Even worse, the author suggests investing in gold to cover these periods. First, gold had a 20% return from 1938 – 1948 since the US was on the gold standard (but readjusted). That is way worse than the 60/40 portfolio.
The US went off the gold standard in 1971 so the idea that the returns on gold would be the same now is a joke. The price was artificially low when we came off the standard.
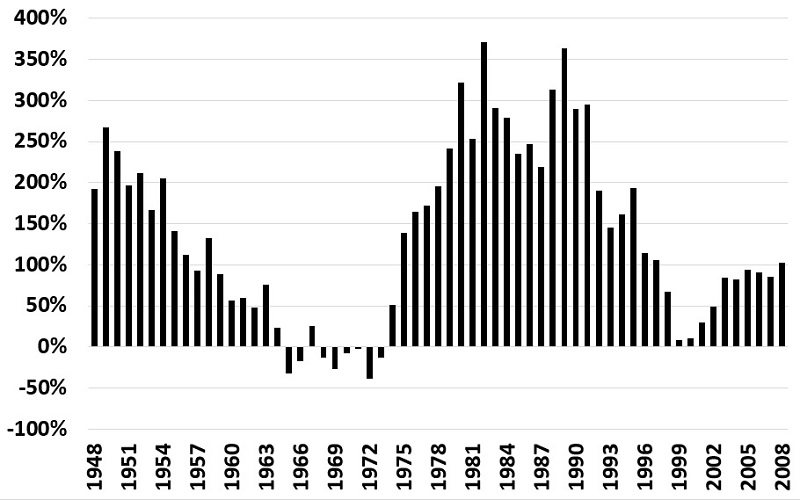
The best advice for someone who is worried about real returns? Why wouldn’t the author just say to by U.S. Treasury TIPS. Right now you can lock in a 1.14% real return for 5 years or 1.15% for 10 years instead of ‘risking’ that gold will provide those returns. But let’s look at the bigger picture. Let’s look what the real return on the 60/40 portfolio would have been over the next 10 years if you made an investment in any year from 1948 (when BLS data starts on CPI) to 2008 (the last year we have 10 years of forward returns for).

Only in 8 of the 61 years (13%) do you lose to inflation. I’ll take my changes with the 60/40 portfolio.
The bottom line: Don’t trust what you read.