Still a Lot of Stories to Add to House Prices
A lot of people have been asking me if we are in another housing bubble. Short answer: we aren’t even close. To reach 2005 affordability, prices need to increase 70% from here.
Below is a graph that shows how much prices would need to increase to reach average affordability from 1987-2021 and to reach bubble level affordability based on different mortgage rates. Affordability here is defined as how much income you need to afford the median home.
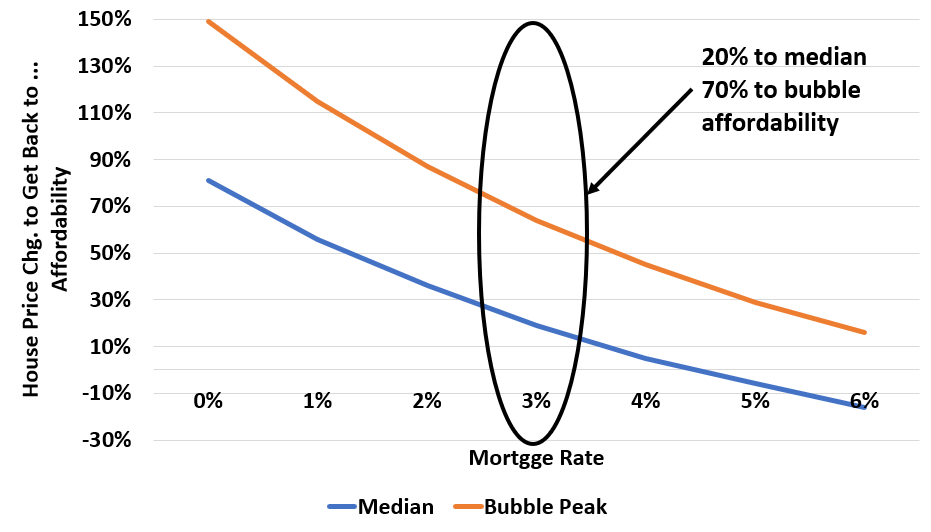
Why is there so much room to run? Since 2005 we’ve had 16 years of inflation (30-40%) as well as MUCH lower mortgage rates (7% in 2005).
Bottom line: Housing has a long way to go before we get even close to unaffordability. In fact, housing is cheaper now than than on average during the last 35 years.