Wage Growth and Mixology
The August labor report came today. You can read lots on jobs and the unemployment rate other places. I want to focus on wage growth, which is now up to 4.3% year-over-year and likely understated.
Let’s take a look at wage year over year wage growth for the last 15 years.
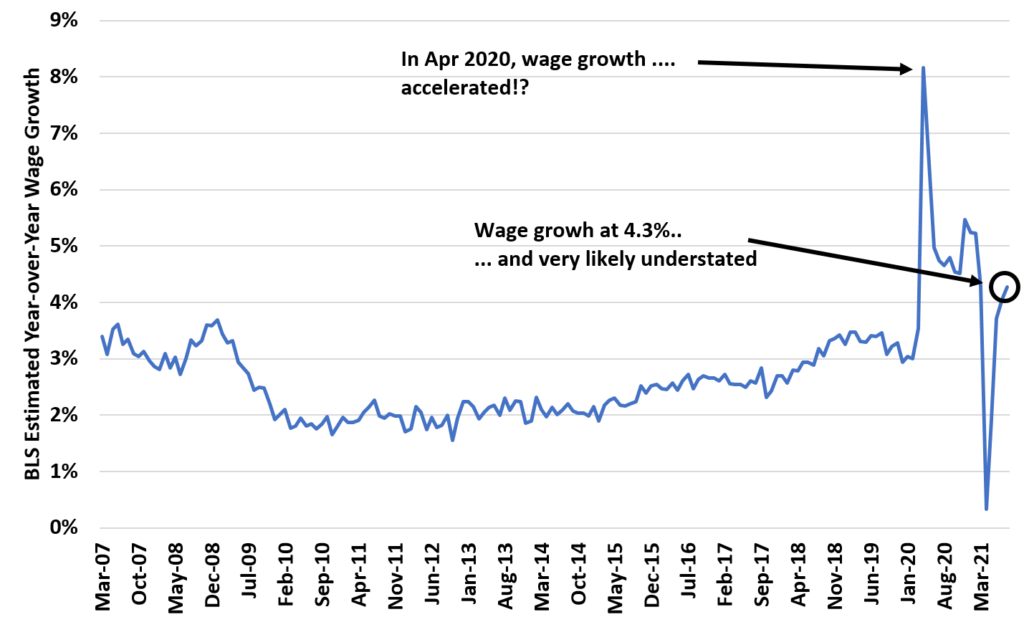
Two things really stick out from this chart. The first is that wage growth is still accelerating. It’s up to 4.3% now. One way that inflation will become embedded is if wages growth accelerates. Then people have more money to spend etc. So this is important to watch.
The other issue is that the 4.3% is likely understating true wage growth. Why do I say that? Well, check out that big spike where wages were going up 8% year-over-year in April 2020.
Wait. Wasn’t April 2020 when the entire economy was shutdown?!
That is correct. So why did wages spike? It’s because the mix of jobs changed. What jobs were lost in April 2020? Service and hospitality jobs, which pay less than finance or tech jobs. Thus this spike is simply due to the MIX of jobs changing. Average hourly earnings in the report is just calculated using the wages of people that have jobs. So when those service/hospitality jobs were lots, wages went up.
Why is that important now? We are adding back these, on average, lower paying jobs. That actually is a negative drag on average hourly earnings since the MIX is going back to what is was.
So that means that wage growth is likely north of 4.3%. Some back of the envelope calculations would suggest closer to 5%.