Today’s CPI report was the first in almost **two years** that showed a decline in ‘sticky’ inflation. This is likely the beginning of a substantial downward trend in inflation
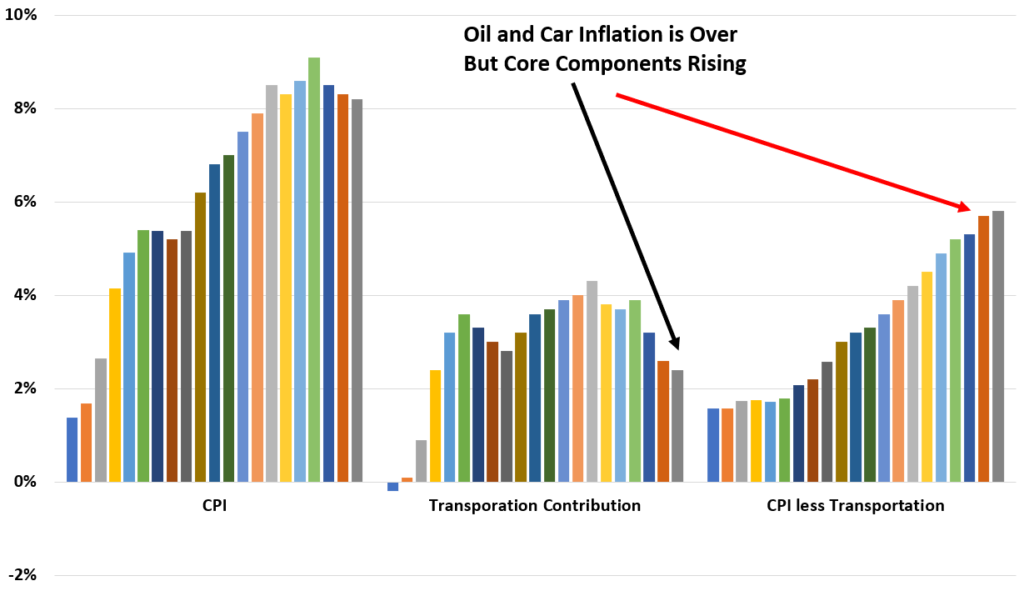
Many of you have seen me post this graph before. It’s CPI on the left. The middle is how much comes from transportation and then end is what’s leftover. I started doing thing because the rebound in oil prices was expected after being -$32 in March 2020.
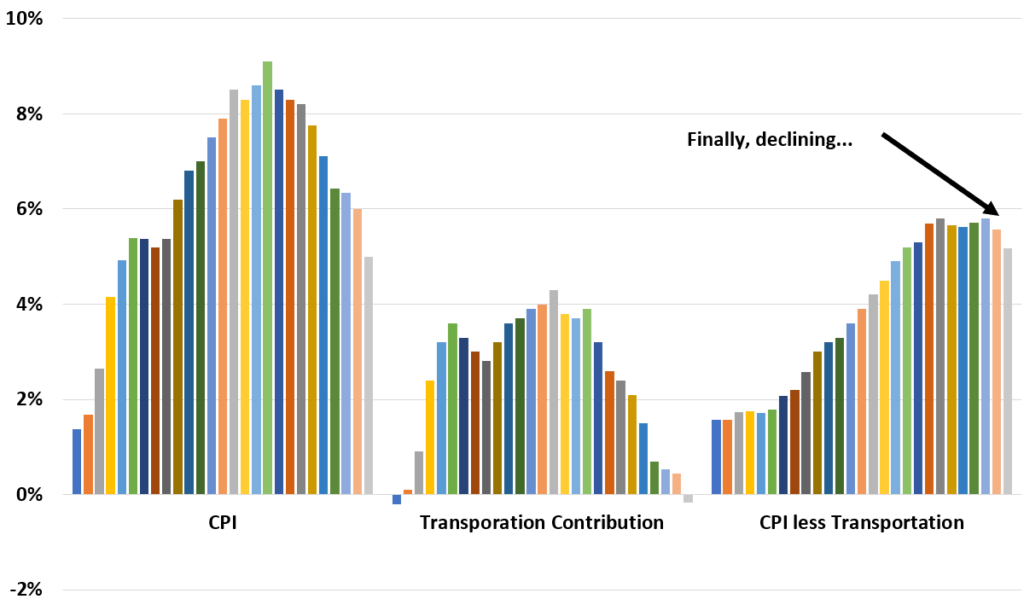
After going straight up and holding for 22 months, my CPI measure is finally coming down. The transportation decline is making regular CPI look better than it is now.
Over half is what is left is shelter which should be declining as well soon since more real time indices of shelter have declined a lot the last few months. However, even if I remove shelter completely, my measure is still over 2%.
The bottom line is the Fed is probably done raising rates for now. The questions are: a. Did they go to far or b. Did they not go far enough? I’m guessing they went too far.